How to read a inverted head and shoulders chart
What is a inverted head and shoulders chart?
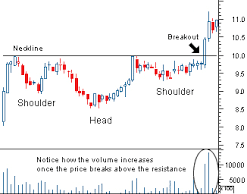
With a inverted head and shoulders chart the neckline is drawn through the highest two points of the troughs. As you can see in the chart the neckline is showing you that at around 10.0 is right about the range they got to. When you see a downward sloping neckline this is a signal showing weakness and is less reliable as a reversal signal.
You can determine the extent of the breakout move by carefully considering the breakout point. This can be estimated by measuring from the top of the middle trough up to the neckline.
How to read a inverted head and shoulders chart?
As you can see on the chart below the breakout point is after it breaks through the 10.0 neckline. Also I expressed the importance of volatility and how to interpret it in my first post. As you can see when the stock does break through the 10.0 mark. The volatility spikes showing you that there is increased interest in the stock and that there is willing investors to purchase the stock at a higher price. Please refer to my first post about volatility to help you better understand how to read stock charts.