How to read a head and shoulders chart
What is a head and shoulders chart?
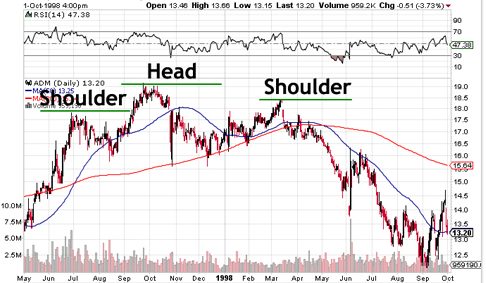
A head and shoulders pattern consists of a peak followed by a higher peak and then a lower peak with a break that is below the neckline . The neckline is drawn through the two lowest points on the intervening channels and these can slope upward or downward. As you can see on the chart below on the 2 shoulders the peaks are in the range between 17.5 and 18.5 but when it gets to that range it is encountering resistance. As you can see this is showing a downward sloping neckline. A downward sloping neckline is also usually a bit easier to follow. You can determine the extent of the breakout move by measuring from the top of the middle peak down to the neckline. This target is then projected downwards from the point of breakout. Please stay tuned, as I will be posting an inverted head and shoulders chart which will be projected to rise from the breakout point.
![]()