How to read and trade a double bottom chart
What is a double bottom chart?
A double bottom is a charting pattern used in technical analysis. What is technical analysis? In finance, technical analysis is a security analysis methodology for forecasting the direction of prices through the study of past market data, primarily price and volume. It shows the drop of a stock, a rebound, another drop to the same (or similar) level as the original drop, and finally another rebound. The double bottom looks like the letter “W”. The twice touched low is considered a support level.
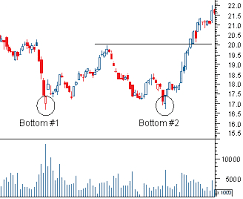
The next thing I will be focusing on is how to read and trade a double bottom. As you can see in the chart below with “Bottom #1” and “Bottom #2”. The stock or index are encountering resistance/support right around the 16.5 area on two separate occasions. Now that we have spotted the double bottom. We know that this stock has had support by rebounding twice around 16.5 area. With that being said just because you see a double bottom. There are still many more factors that you will want to take in account before pulling the trigger and investing in a company. So I will be making plenty more posts explaining double top charts head and shoulders charts and the advantages they have. Along with a bunch of key factors and technical analysis on how to interpret P/E ratios, dividends, stock buybacks, etc.