How to read and trade a double top chart
What is a double top chart?
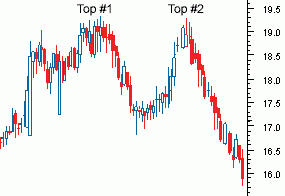
A double top chart is a charting pattern used in technical analysis. What is technical analysis? In finance, technical analysis is a security analysis methodology for forecasting the direction of prices through the study of past market data, primarily price and volume. The double top pattern is found at the two highest points of the chart. As you can see in the chart below “Top #1” and Top #2 is in the range between 19.0 and 19.3 before it starts to trend down. The double top pattern is found at the highest ranges of a progressing upward trend. This is a clear signal that the progressing upward trend is showing resistance to break through that range. Spotting this trend is very helpful and a great indicator that investors are hesitant to purchase this security when it is in that range. In fact it is showing you that the investors are seeing resistance at that range. As you can see on the chart the “Top #1” section the investors sell off their shares to a previous resistance level in the range of 17.0 and 17.3. The next stage of this pattern will see the price start to move back towards the level of resistance found in the previous run-up which is “Top #1”. In this case when you see the security reach the same range in “Top #2” which is right around the 19.0 and 19.3 range and is not able to break through the resistance. Now that you have spotted the double top pattern you will start to see the stock trend downward.
